Determine Similarity of Documents


March 30 2019


In this post we explain how the application of co-sine similarity calculate between tf-idf vectors can determine how similar one document is to another document.


Similarity and tf-idf

In our previous blog post, we defined and explained tf-idf – which is how we isolate keywords and phrases in documents for the purpose of comparing and contrasting them. By pulling out specific terms we are able to dig deeper and really see how these documents compare, and by what degree they are the same.


Lets use the documents displayed in following image to explore how tf-idf is used to determine document similarity.


We use a graph to map out our data, so there is a visual representation of each document that demonstrates how they relate to one another. As they say a picture is worth a thousand words. All we have to do is find a way to graph the tf-idf data, displayed in the image below, then quantify what we see.


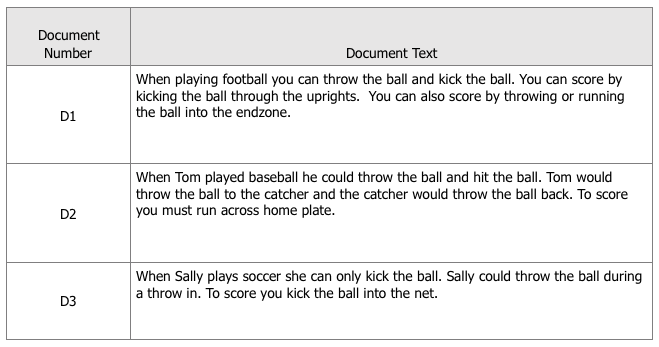
First, you will notice that tf-idf takes the three documents and converts them into a long skinny list. This list can be thought of as a vector, the start being the top and the bottom being the end.


Yes, for the purpose of this simple example, our documents are just a few sentences each, but with this method the length of the document is irrelevant because the way we are going to quantify the visualization is to measure the angle from one line on the graph to another. (You can imagine if we computed a tf-idf vector for a book or long article that a wide and very long structure of words would become a shorter vector).


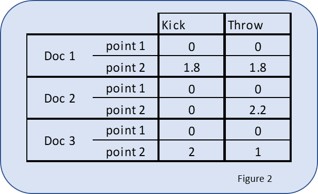
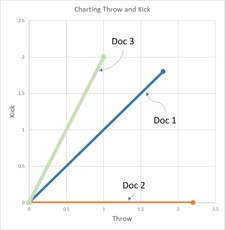
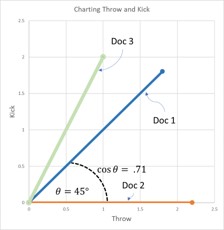
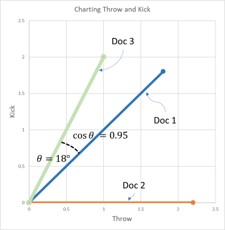
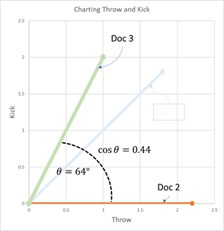
Basically, we are using the tf-idf data to determine a similarity score, which is the cosine (the angle) that exists between the tf-idf vectors (or lines on the graph) of two documents. The documents with the smallest angle between them on the graph feature more similarities than differences.


Once we have the vectors, we plot them on our graph. Each word would be an axis in the graph and you would have a line for each document. However, even for our very simple example we would require a 12-dimensional graph. While computers can plot information like this, it’s impossible to demonstrate in 2D.​


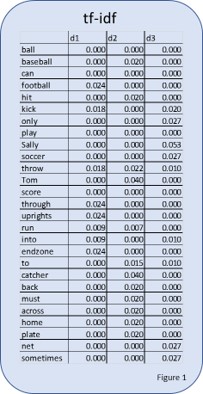
To create a 2D graph we will simplify our example. Let’s assume for the purpose of this article that you are only interested in the words ‘throw’ and ‘kick.’ Perhaps you are trying to invent a game where you throw or kick a ball, and want to make sure no one else has done this before. By simplifying it to only two terms, this allows us to create a 2-dimensional graph with ‘throw’ on one axis and ‘kick’ on the other.


If we look at the tf-idf vectors in the large table at the start of the document, and pull the words “throw” and “kick” out, we get the table just above, representing these vector points. Because these are vectors they all get a starting point, which is the point (0,0) (note: each value has been multiplied by 100 to make the graphic a bit tidier)


Remembering back to our previous post, we apply stop words and stemming to the lengthened documents and we get the tf-idf table shown below. So, how does this help us determine if an idea is similar to one that is already out there?


When we plot these three different vectors on a graph, we get the graph below.


We can visually inspect the graph and see that Doc 2 doesn’t have the word “kick.” We can also see that Doc 3 has the word “throw,” but the word is less important in Doc 3 than the word “kick.” We can also see that Doc 1 includes both words and that both words are of equal importance to the document.


To quantify the similarity, you look at the angle between the two documents that you are comparing. To simplify the mathematics of determining the angle we calculate the cosine of the angle rather than the degree of the angle. This results in documents that are similar being closer to the number 1.


When we compare Doc 1 to Doc 2, in the graph above we see the angle is 45-degrees, which gives a cosine of 0.71.


When comparing Doc 1 to Doc 3 as shown above, the angle is 18-degrees, which gives a cosine of.95


When comparing Doc 3 to Doc 2, it creates a 64-degree angle, which gives a cosine of .44; demonstrating that the documents are not very similar as is shown above.


There is an interesting side effect of using the angle to compare the documents. That is the length of the document doesn’t matter. It is a benefit of “geometry”, the angle is the angle no mater how long one side of the angle is.


Computers and math can handle multidimensional spaces greater than 3 the dimensions of our everyday world. This means we can do more than compare two words across all documents, we can compare all words across all documents. In the case of our simple example we would create a 12-dimensional space so that we can compare the entire tf-idf vector of each of the documents. I just don’t know how to envision a 12-dimensional graph, let alone draw one.


Interesting but how does this help determine if something is unique?

How would we use this to determine if an idea or patent is unique? Well if we gather up a whole bunch of documents about the same topic, such as “sports,” and we computed the tf-idf for all those documents and we calculated the cosine between the tf-idf of our new sports idea and all of the other documents we gathered. Well we would end up with a very useful indication of how unique our idea is.


Imagine if the description of our idea ends up with a cosine of .01 when compared to every one of the other documents on sports. That would indicate the description of our idea is very different from the description of all the other sports. What if the cosine of our idea ends up at .99 when compared to all the other documents about sports? Well we probably need to head back to the drawing board.