We have seen how to use tf-idf to identify what words or phrases make a document unique and how those tf-idf vectors can be used to compare one document against another. Your next question might be, can we use some more fancy math to group documents that are similar using their entire tf-idf vector and not just one or two words. Funny you should ask that, because the answer is yes, there is some fancy math that we can use. (For those of you who jumped right to this document and are saying what the tf-idf are we doing, please go back and have a quick read of the previous two articles).
The fancy math is K-means clustering. This is also where we start to depart from preparing and comparing data and begin to enter the realm of Artificial Intelligence or Machine Learning. K-means clustering is one of the most widely used unsupervised machine learning algorithms that forms clusters of data based on the similarity between documents.
What is K-means
The first step is to set the number of clusters or groups you want to organize your documents into. The K in the K-means refers to the number of clusters that you want to create. There can be a lot of discussion on what K should be, depending on the number of documents and what you are looking for. We use a couple of different K values depending on a bunch of stuff. The exact values and where we use them is a trade secret.
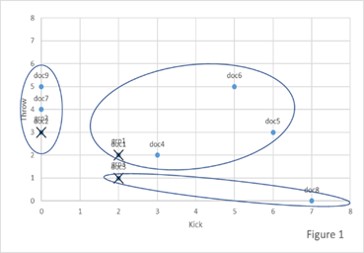
The K-means algorithm starts by randomly choosing one point at random as the center point for each cluster. The center point is the perfect match for being a member of a group. Think of it as setting up a way to group something, like put all the murder mystery books here, all sci-fi books there and romance books over there.
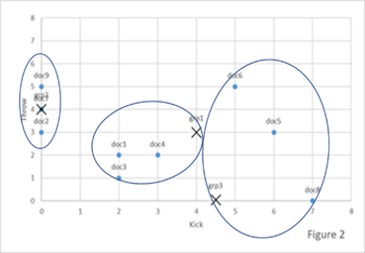
The algorithm then sorts the data into the groups. It then determines how different each of the documents are from being a perfect match for the group they have been assigned. Perhaps there are a bunch of sci-fi romance books, or sci-fi murder mysteries, or murder mystery romances. We would make a judgement call as to which group the book is more like, this book is more sci-fi then romance, or this is way more romance than murder mystery.
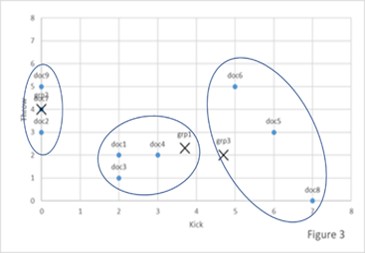
The algorithm then uses the information on how different each of the documents are from the ideal to form new groups, by adjusting the centers of the group which is changing what makes something a perfect match. In our book example we might drop sci-fi and create a new group action-adventure.
The algorithm repeats this process until it has created the most diverse grouping it can by maximizing how close each document would be to the perfect match of the group.
How does it work?
The algorithm uses the straight-line distance between each data instance and centers of each group to determine which group a document would belong to. It will continue to move the center point of each of the groups until the distance between each member in a group and the center point of the group is minimized.
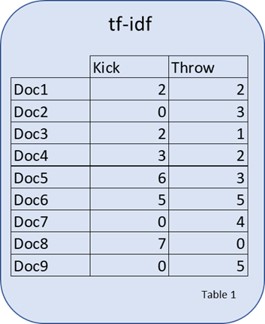
Not very helpful? Let's look at a simple example. We will again turn to the “Kick vs Throw” example. For expedience sake let us assume the tf-idf scores for several documents for kick and throw are as displayed in the table below.